Document Clustering


Clustering The Textos Andinos Files
Approach 1 - K-means and Hierarchical Clustering

On this page we will take a look at what terms are present in the database and what terms are important for distinguishing texts and categories.

Let’s start by loading the spanish documents.

Code
import plotly.express as px
# Initialize plotly
plotly.offline.init_notebook_mode(connected = False);

# Read in the files
csv_dir = f"{kq.project_directory()}/khipufieldmarks/textosbook/data/CSV"
metadata_df = pd.read_csv(f"{csv_dir}/TA_metadata.csv")
summary_df = pd.read_csv(f"{csv_dir}/TA_summary.csv")

spanish_docs = dict(zip(summary_df['name'].tolist(), summary_df['spanish_text'].tolist()))

We can pass the document to modern NLP text mining algorithms which can cluster the text by similarity along the n-dimensions of all the different words and their frequencies in each document.

The usual first step in NLP document analysis is to build a term-frequency, inverse-document-frequency matrix.

Tf-Idf matrices for NLP have a long history. An explanation:

Term Frequency, Inverse Document Frequency and Tf°Idf

As part of training our machine model, we want to give it information about how words are distributed across our set of data. This is commonly done using Term Frequency/Inverse Document Frequency techniques.

The first step, then, is to calculate the term frequency (Tf), the inverse document frequency (Idf), and their product (Tf°Idf) Apologies: There’s an occasional Google Chrome bug with latex/equation rendering - see equations in Safari if you want to understand them

(Tf): TERM FREQUENCY - How probable is that this particular word appears in a SINGLE document.

\(Tf(\omega) = \left( \frac{ \# occurences\ of\ \omega\ in\ document}{\# words\ in\ document} \right)\)

(Idf): INVERSE DOCUMENT FREQUENCY - How common or rare a word is across ALL documents. If it’s a common word across all documents, it’s regarded as a non-differentiating word, and we want to weight it lower.

Alternatively, it can be thought of as the specificity of a term - quantified as an inverse function of the number of documents in which it occurs. The most common function used is log(natural) of the number of docs divided by the number of docs in which this term appears.

\(Idf(\omega) = ln \left( \frac{ \# docs}{\# docs.containing(\omega) } \right)\)

(Tf°Idf):TERM SPECIFICITY Tf°Idf, the product of Tf and Idf, is used to weight words according to how “important” they are to the machine learning algorithm ☺. The higher the TF°IDF score (weight), the rarer the term and vice versa. The intuition for this measure is this:

If a word appears frequently in a document, then it should be important and we should give that word a high score. But if a word appears in too many other documents, it’s probably not a unique identifier, therefore we should assign a lower score to that word.

Tf°idf is one of the most popular term-weighting schemes today. Over 80% of text-based recommender systems, including Google’s search engine, use Tf°Idf. Introduced, as “term specificity” by Karen Spärck Jones in a 1972 paper, it has worked well as a heuristic. However, its theoretical foundations have been troublesome for at least three decades afterward, with many researchers trying to find information theoretic justifications for it.

Ashok Khosla - Detecting Deceptive Hotel Reviews

Code
# NLTK Stop words
# nltk.download('stopwords')
from nltk.corpus import stopwords
stop_words = stopwords.words('spanish')
stop_words.extend(['.', ','])

# Calculate TF-IDF Matrix

def simple_tokenizer(text):
    # first tokenize by sentence, then by word to ensure that punctuation is caught as it's own token
    tokens = [word.lower() for word in nltk.word_tokenize(text) if not ku.is_number(word)]
    # remove numeric tokens
    return tokens

tfidf_vectorizer = TfidfVectorizer(max_df=.9, max_features=200000,
                                   min_df=.1, stop_words=stop_words,
                                   use_idf=True, tokenizer=simple_tokenizer, ngram_range=(1,3))
corpus = list(spanish_docs.values())
tfidf_matrix = tfidf_vectorizer.fit_transform(corpus)

# terms = tfidf_vectorizer.get_feature_names_out() # Newer version problem....?
terms = tfidf_vectorizer.get_feature_names()
cosine_distance = 1 - cosine_similarity(tfidf_matrix)

term_freq_df = pd.DataFrame(tfidf_matrix.toarray(), 
                             index=[list(spanish_docs.keys())],
                             columns=terms)

K-means clustering


Traditionally the next step is to use a variety of clustering methods. Here I will only use two. The first, K-means clustering, groups the “documents” based on n-dimensional clustering of the bag of words contained in the documents. I’ve used K-means in the past. It’s not a great clustering algorithm, but it has the advantage that it outputs discrete groupings which can be handy. So I always do it as a first pass.

Code
num_clusters = 4

km = KMeans(n_clusters=num_clusters)
km.fit(tfidf_matrix)
clusters = km.labels_.tolist()
KMeans(n_clusters=4)
Code
doc_cluster_dict = { 'doc_name': spanish_docs.keys(), 'document': spanish_docs.values(), 'cluster': clusters  }
doc_cluster_df = pd.DataFrame(doc_cluster_dict, index = [clusters] , columns = ['doc_name', 'document', 'cluster'])
#display_dataframe(doc_cluster_df)

kMeansClusters = []
for cluster_id in range(num_clusters):
    docs_in_cluster = doc_cluster_df[doc_cluster_df.cluster == cluster_id].doc_name.values.tolist()
    kMeansClusters.append(docs_in_cluster)
    print(f"{cluster_id}:({len(docs_in_cluster):02d}) docs:\t {docs_in_cluster},")
 
0:(19) docs:     ['m_01', 'm_02', 'm_03', 'm_04', 'm_06', 'm_07', 'm_08', 'm_09', 'm_10', 'm_11', 'm_13', 'm_18', 'm_24', 'm_27', 'm_52', 'm_59', 'm_61', 'm_71', 'm_72'],
1:(13) docs:     ['m_20', 'm_21', 'm_28', 'm_29', 'm_30', 'm_32', 'm_38', 'm_39', 'm_41', 'm_44', 'm_45', 'm_46', 'm_58'],
2:(24) docs:     ['m_22', 'm_23', 'm_25', 'm_26', 'm_31', 'm_33', 'm_34', 'm_35', 'm_36', 'm_37', 'm_40', 'm_42', 'm_43', 'm_47', 'm_48', 'm_50', 'm_51', 'm_53', 'm_54', 'm_55', 'm_56', 'm_57', 'm_60', 'm_63'],
3:(16) docs:     ['m_05', 'm_12', 'm_14', 'm_15', 'm_16', 'm_17', 'm_19', 'm_49', 'm_62', 'm_64', 'm_65', 'm_66', 'm_67', 'm_68', 'm_69', 'm_70'],

Code
import os
english_text_dir = f"{kq.project_directory()}/notebook/textos_andinos/data/ENGLISH_TXT"

def review_cluster(documents):
    for docname in documents:
        filename = f"{english_text_dir}/{docname}.txt"
        os.system(f"open -a 'Brave Browser' '{filename}'")
        
#review_cluster(kMeansClusters[3])

A review of the text breaks them down roughly as follows:

Cluster Index Number of Documents Grouping
0 20 Census documents of towns
1 15 Tribute with Agricultural Goods (Wheat, Sheep, Chickens, etc.)
2 19 People and the towns they run, plus huaca descriptions
3 18 Tribute with Labor & Agricultural Goods (Wheat, Sheep, Chickens, etc.)

Hierarchical Clustering

Hierarchical clustering, uses “cosine similarity” (i.e. how close together are two normalized vectors in an n-dimensional bag-of-words frequency matrix) to group together and cluster documents. In my experience, it generally performs better than Kmeans or Principal Component Analysis. Although I prefer the R package for clustering, Python provides graphics adequate for the job at hand.

Code
Z = ward(cosine_distance) #define the linkage_matrix using ward clustering pre-computed distances

fig, ax = plt.subplots(figsize=(15, 10)) # set size
ax = dendrogram(Z, orientation="left", labels=list(spanish_docs.keys()));

plt.tick_params(\
    axis= 'x',          # changes apply to the x-axis
    which='both',       # both major and minor ticks are affected
    bottom='off',       # ticks along the bottom edge are off
    top='off',          # ticks along the top edge are off
    labelbottom='off')

plt.tight_layout() #show plot with tight layout

#uncomment below to save figure
plt.savefig('../images/text_hierchical_clustering.png', dpi=200) #save figure as ward_clusters

# Clustered 
sorted_by_similarity = ax['ivl']
print(sorted_by_similarity)
#pd.DataFrame(sorted_by_similarity).to_csv(f"{kq.qollqa_data_directory()}/kHierarchicalCluster.csv")     
['m_32', 'm_28', 'm_20', 'm_29', 'm_21', 'm_41', 'm_30', 'm_38', 'm_39', 'm_43', 'm_58', 'm_44', 'm_45', 'm_46', 'm_37', 'm_31', 'm_33', 'm_54', 'm_50', 'm_51', 'm_48', 'm_53', 'm_57', 'm_35', 'm_47', 'm_22', 'm_42', 'm_34', 'm_40', 'm_69', 'm_14', 'm_15', 'm_16', 'm_66', 'm_67', 'm_05', 'm_64', 'm_65', 'm_68', 'm_08', 'm_09', 'm_10', 'm_07', 'm_59', 'm_11', 'm_13', 'm_27', 'm_52', 'm_01', 'm_06', 'm_72', 'm_24', 'm_02', 'm_04', 'm_36', 'm_55', 'm_61', 'm_56', 'm_60', 'm_63', 'm_23', 'm_25', 'm_26', 'm_71', 'm_12', 'm_62', 'm_17', 'm_19', 'm_49', 'm_03', 'm_18', 'm_70']

Code
if not ('document_name' in list(term_freq_df.columns)):
    term_freq_df.insert(0, 'document_name', spanish_docs.keys());
term_freq_df = term_freq_df.set_index('document_name').reindex(sorted_by_similarity)
#transposed_term_freq_df = term_freq_df.T;
#transposed_term_freq_df = transposed_term_freq_df.drop(index='document_name');
#transposed_term_freq_df
Code
#term_freq_df
Code

# Sort Term Frequency matrix by columns that are similar using cosine similarity (dot product)
# Start with most common term, which is se

term_column_names = list(term_freq_df.columns)
def freq_vector_at(index):
    return list(term_freq_df.iloc[:, index])
def unit_vector(name):
    col_index = term_column_names.index(name)
    col_vector = list(term_freq_df.iloc[:, col_index])
    return ku.as_unit_vector(col_vector)
col_vectors =  {name:unit_vector(name) for name in term_column_names}

new_columns = ['indios']
old_columns = [name.strip() for name in term_column_names if not (name in new_columns)]
while old_columns:
    best_match = 0.0
    match_column = ""
    match_vector = col_vectors[new_columns[-1]]
    for search_name in old_columns:
        search_vector = col_vectors[search_name]
        dot_prod = sum([ match_vector[i]*search_vector[i] for i in range(len(match_vector))])
        if dot_prod > best_match:
            match_column = search_name
            best_match = dot_prod
    if len(match_column) > 0:
        new_columns.append(match_column)
        old_columns.remove(match_column) 
    else:
        break


LU_term_freq_df = term_freq_df[new_columns].T

# Use CosineSimilarityMatrix functionality from KFG to cluster/sort this array
LU_row_names = LU_term_freq_df.index.values.tolist()
LU_col_names = LU_term_freq_df.columns.values.tolist()
LU_sorted_df = ku.CosineSimilarityMatrix(LU_term_freq_df, column_names=LU_col_names, row_names=LU_row_names).sort()
Code
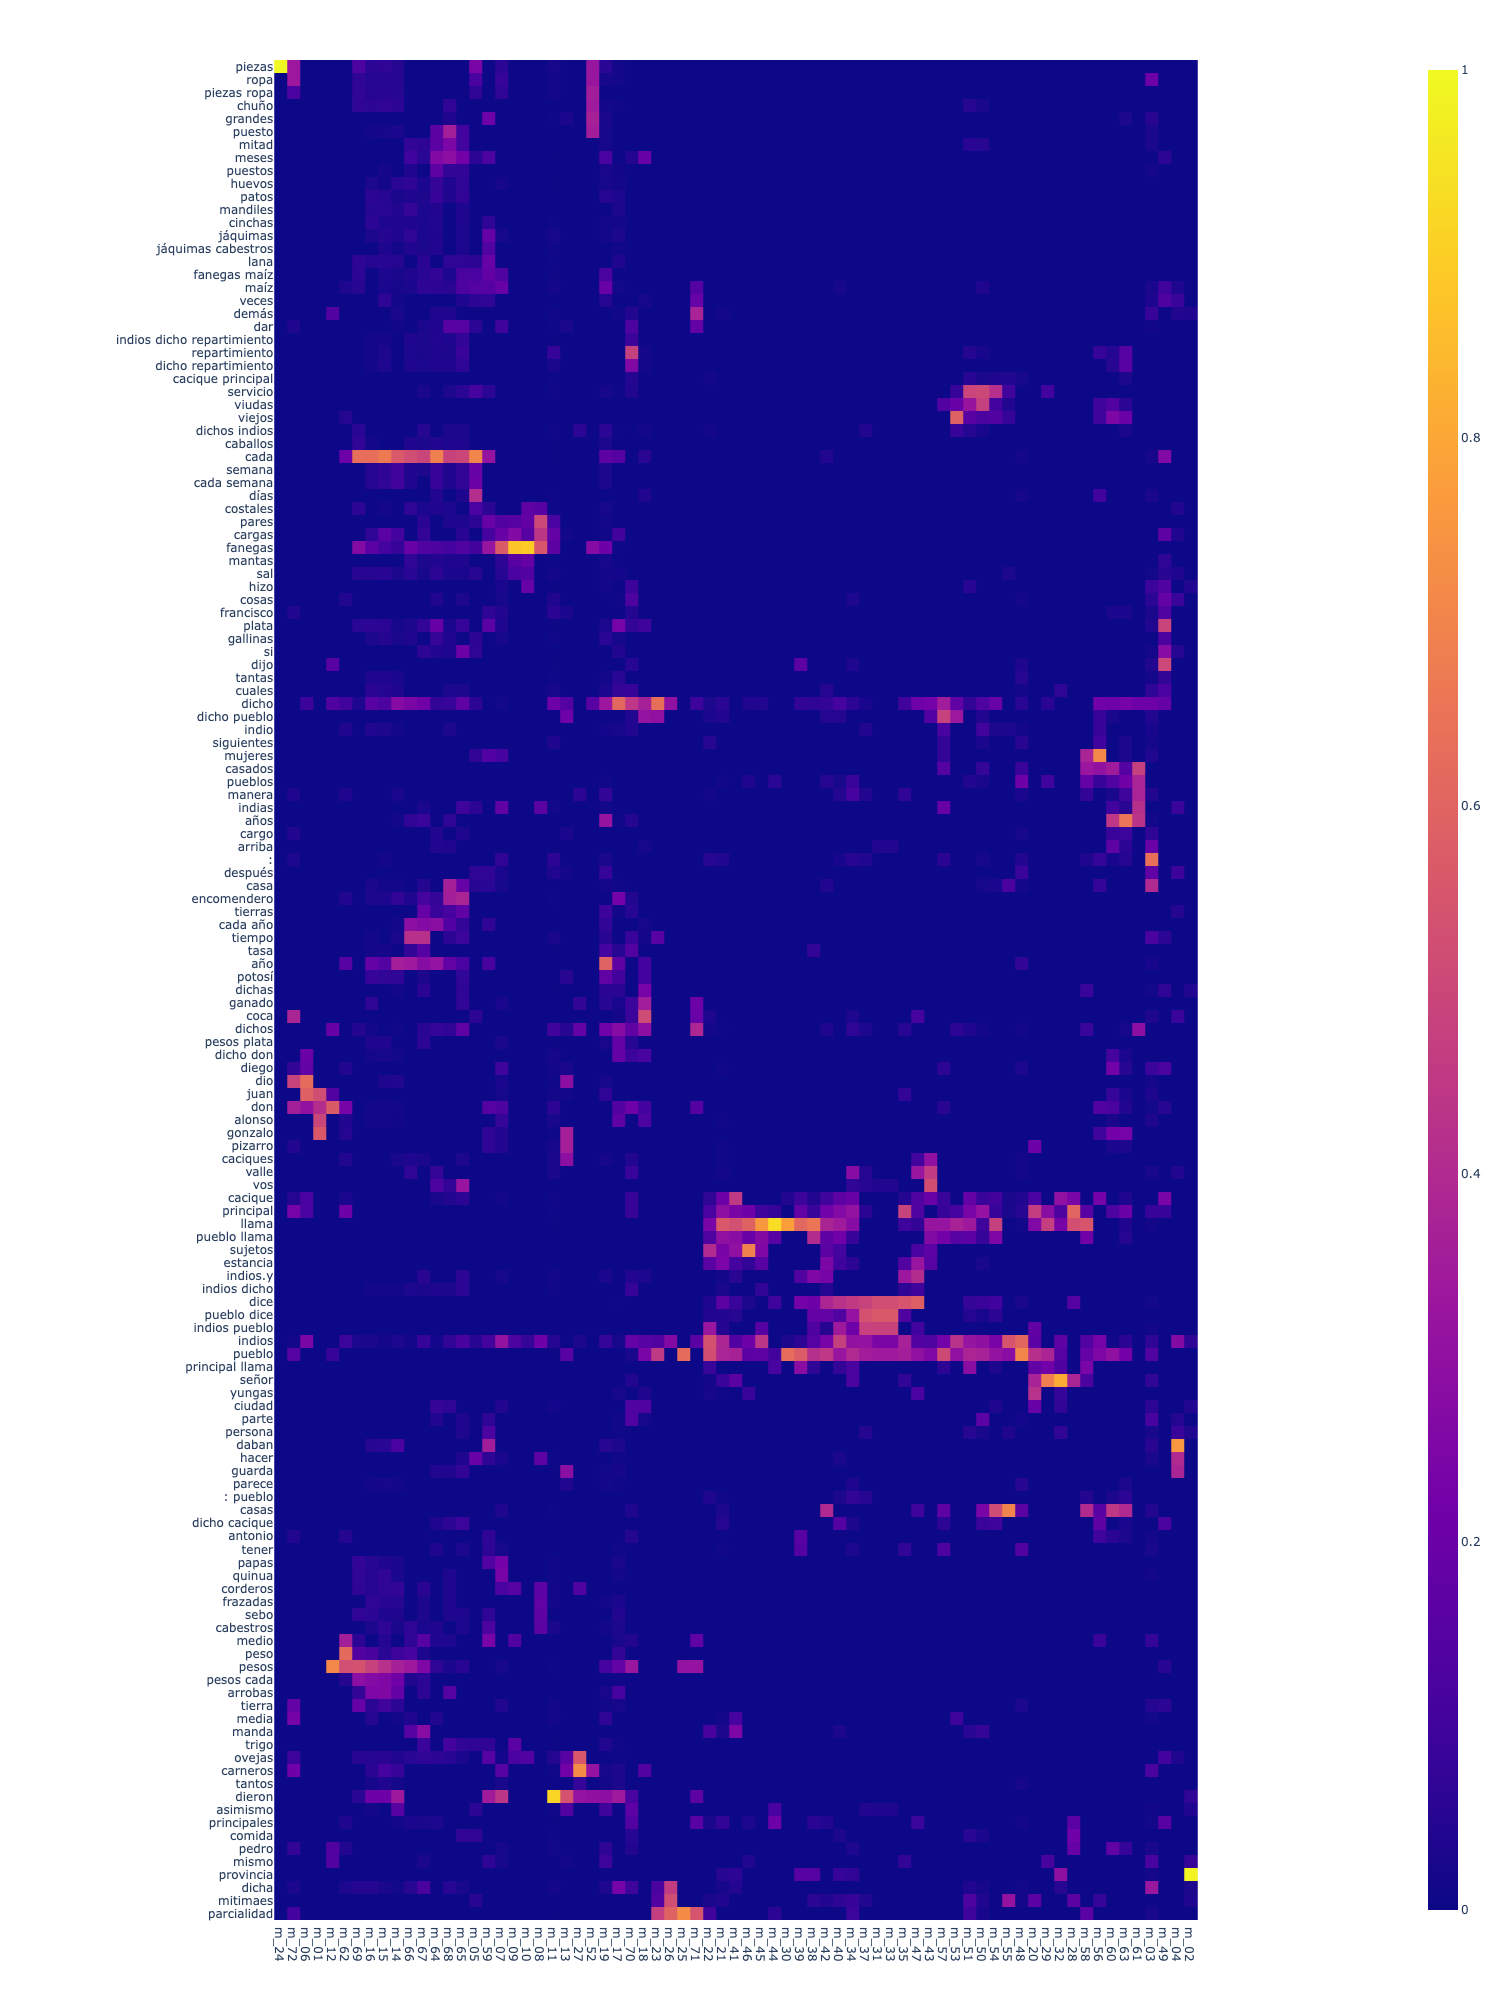
# fig = (px.imshow(LU_sorted_df, width=944, height=2500)
#         .update_coloraxes(showscale=False)
#         .update_layout(yaxis = dict(dtick = 1),xaxis = dict(dtick = 1))
#         .show())

LDA Topic Model

This shows three broad clusters.

  • Cluster one is the most evident. This cluster is accounts of “indios” (tributaries/taxpayers) and their caciques/locations.
  • Cluster two is accounts of good and services, with words like fanegas (bushels), ovejas (sheep), etc. and takes up the majority of the left half of the document above.
  • Cluster three is in the upper right, and also appears to be some sort of census document.

For now, I’m going to call the first and third clusters census documents, and the second cluster tribute documents.

In the next section, let’s explore a more sophisticated approach to document clustering - LDA Analysis.